/
Research
/
0 min read
State of e-commerces through turbulent years
Involves e-commerce companies that are currently working with SEO
Only selected if they have had data for the entire 24 month period (May 1, 2020 - May 30, 2022)
The sample size is larger for traffic than for revenue, as not all companies had revenue in their Google Analytics
Companies are predominantly Danish and on the Danish market, but as far as possible all markets have been considered (including the Swedish and Norwegian markets).
Why this analysis?
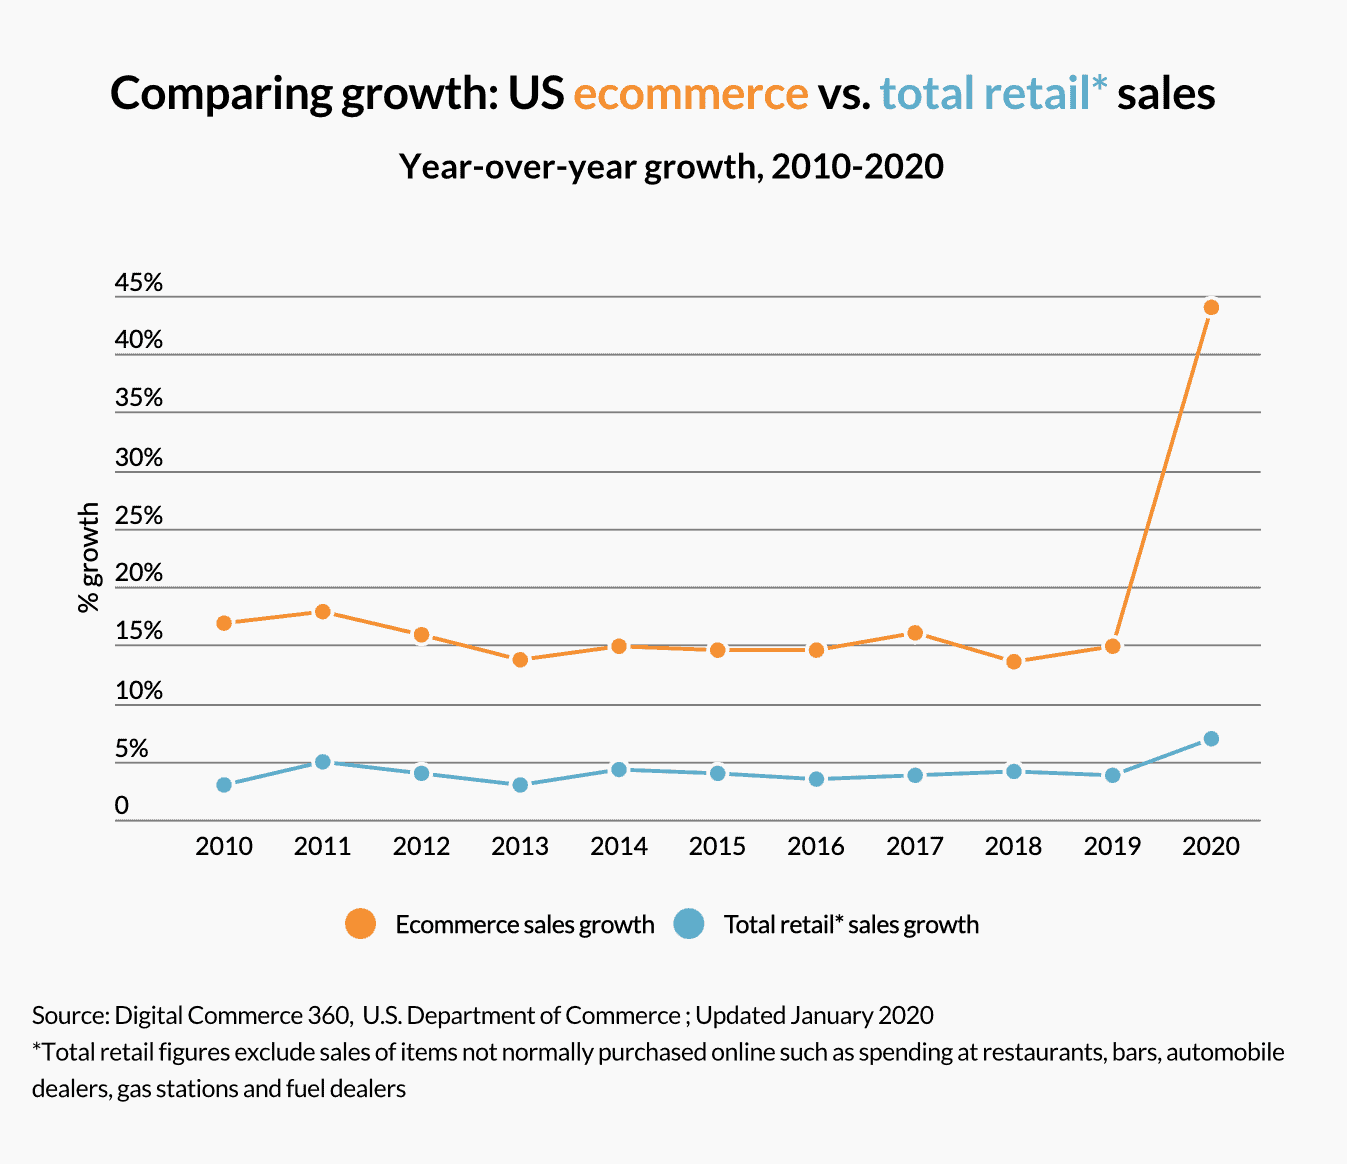
Covid-19, war, inflation, and rising product prices have all made their mark on societies and commercial industries across the globe. One industry in particular has been highly affected by these factors: e-commerce. In the US alone the market saw a +44% increase in sales during 2020 when the world was all remote.
Today — in mid-2022 — we have largely returned to the world as we know it from before the pandemic — although macroeconomic trends still impact consumer behaviour.
Therefore, we have analyzed the e-commerce industry based on +60 Northern e-commerces to get an idea of how the industry is doing today. In other words, in this entry we go in-depth with the state of e-commerce in order to understand market development in the industry.
Method
All data has been sampled from Google Analytics, and all data is set to index 100 to allow easier comparison.
Two further metrics have been used: revenue and sessions.
Sample data:
Overall results for traffic and revenue
The following graph shows the overall development of traffic and revenue averaged across all e-commerces:
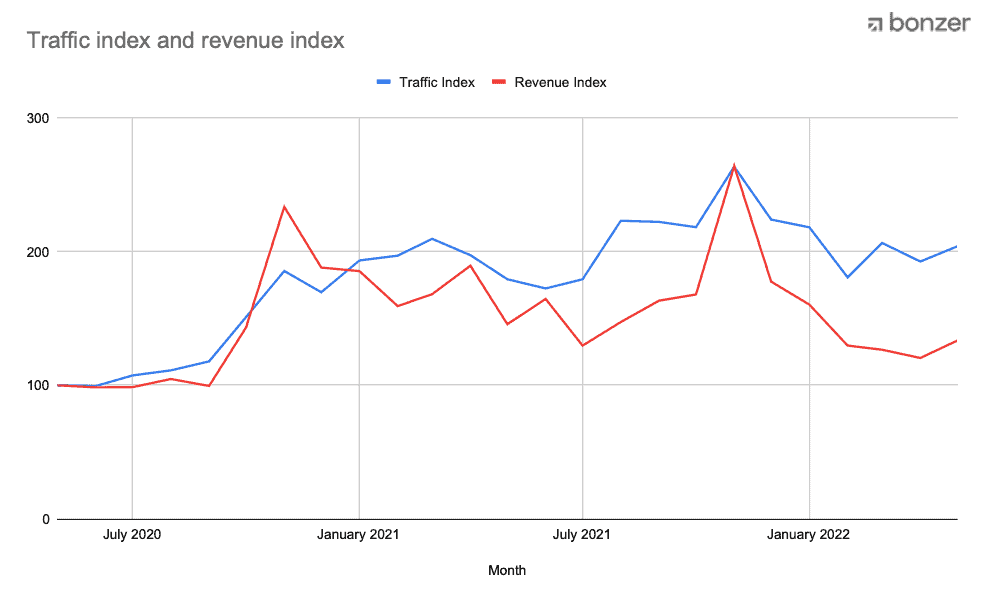
Based on an index 100, it's clear that both the traffic and revenue shot up to double normal traffic during the summer of 2020 after the announcement of lockdown in Denmark. After this we’ve seen an above-normal revenue and traffic that peaked in the fall of 2021.
After the turn of the year, we’ve seen a return to normalcy with especially revenue approaching what it was before Covid-19 (even though it is still above index 100 and seems to be increasing a bit again).
Traffic is still above-normal, which could indicate that people still browse and explore, but simply buy less than before, which can be seen in the gap between traffic and revenue.
So even though we have seen a drop in the latest couple of months, it still looks like the pandemic might have changed how we consume to being more digital than before due to a faster — and perhaps easier — way of shopping.
For different niches
It's one thing to look at e-commerce in general. But in order to understand variations, we have looked deeper into the different niches and compared to the average.
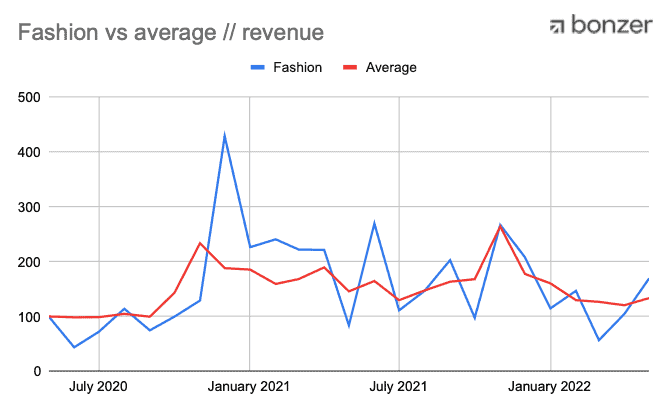
The fashion industry keeps attracting people — but revenue is more or less back to normal
The traffic for fashion e-commerce has, until the end of 2021, been quite the same as the average. But in the beginning of 2022, fashion took a big step up, indicating that even more consumers went online to explore products in this niche.
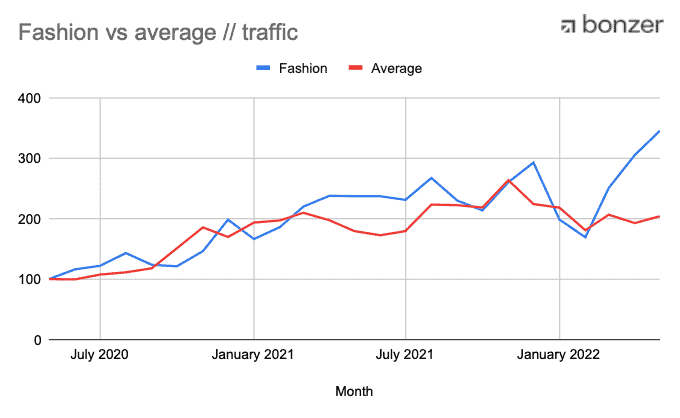
But as mentioned, traffic and revenue are not necessarily the same, which is also clear when looking at this niche revenue. Here, we see that fashion and the average are around the same level today.
Leisure & lifestyle has been an average "increaser"
During the early days of the pandemic there wasn't much time for leisure as we want leisure to be. But from January 2021 until today, both traffic and revenue for leisure & lifestyle have increased. It is also in this period that the world opened up more and travel became a possibility again.
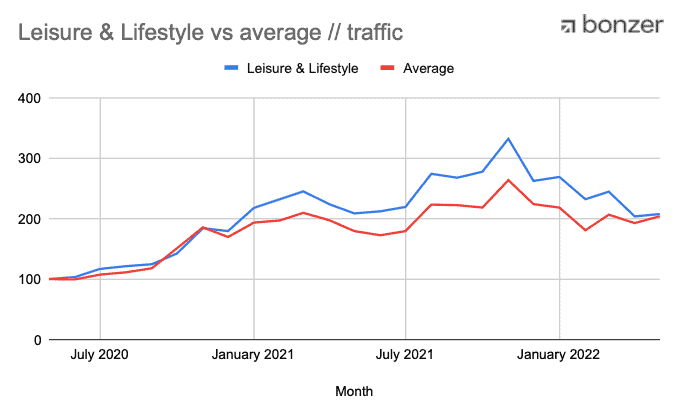
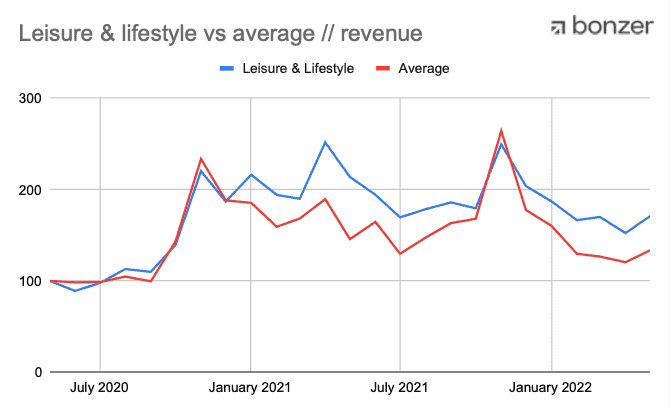
Today, the gap between the leisure & lifestyle niche and the average is almost closed in traffic. This could be due to some of the macroeconomic trends we see today, or due to higher prices around the world — and, for some, a more uncertain future.
Still, the revenue is higher than average, which could indicate that even though we are back to normal when it comes to traffic, the prices are higher, and therefore the revenue is above average in this niche.
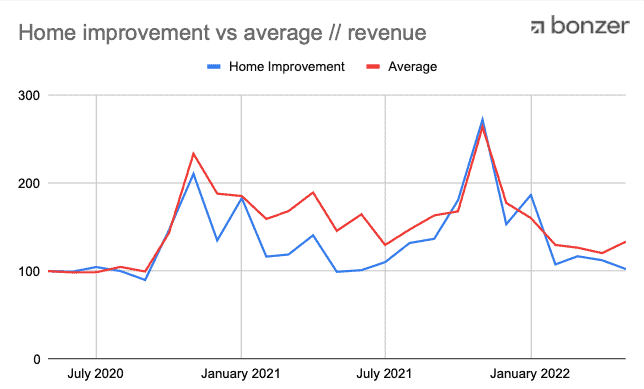
The more we're home the more improvements we need
In a modern everyday life, people can be too busy to think about what to fix or what to improve in their homes. But when forced to stay at home, day by day we feel an increased need for home improvements. This was exactly what we saw during the pandemic, which you can see in the graph on traffic.
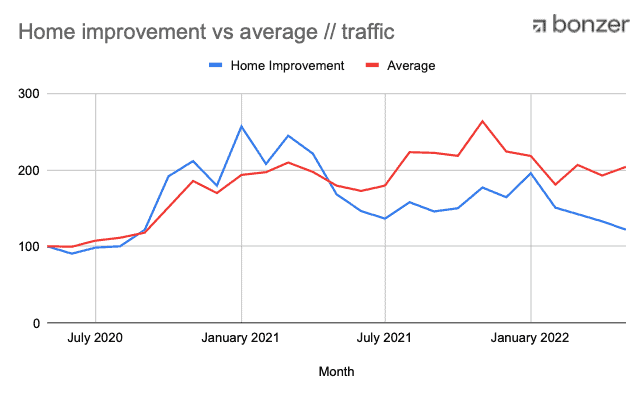
Today we can see that the traffic has dropped to below average due to our need for exploring the outside world again. This we can also see in the revenue compared to average.
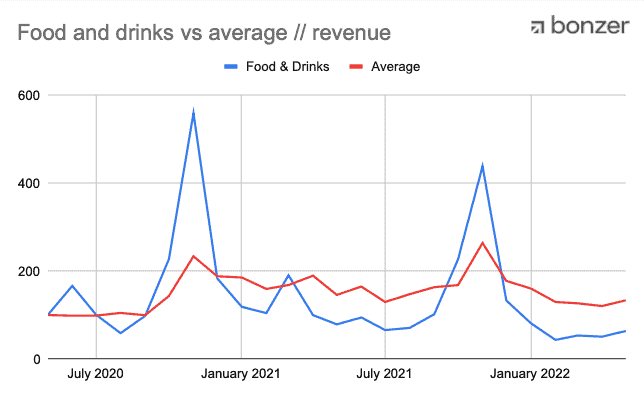
At the height of the pandemic, the fall season was high on both traffic and revenue.
In the food and drinks industry, both October/November 2020 and 2021 have shown great spikes in traffic and revenue when bars and restaurants began to open their doors to the public again. Today we're back to normal — but traffic has actually grown to be above index 200. This indicates that consumers have gained more search habits for food and drinks.
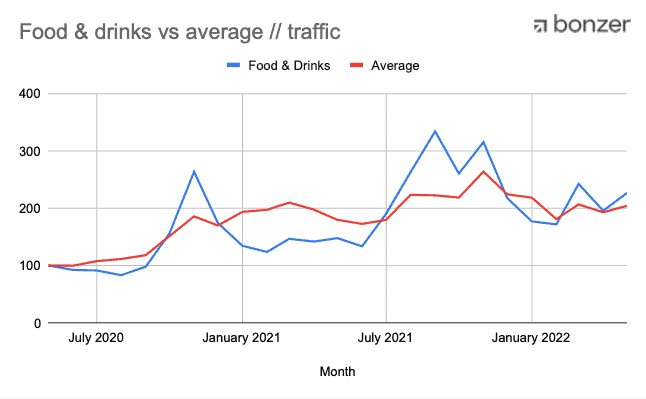
The picture today is on the lower end of the scale when looking at revenue, which could also be due to higher prices than normal.
What does the future look like?
This question we all ask ourselves: what will the future of my business look like? What will my company revenue look like?
The analysis above gives us a good indication based on consumer behavior. Comparing the numbers during and after the pandemic, it's clear to see that macroeconomic phenomena gave e-commerce a big increase in both traffic and revenue.
Even though today we're returning to normal, it's clear that both trends and habits have given us an improved way of shopping. Traffic is doubled to index 200, and revenue is also above index 100.
So even though we may be feeling a downside to the pandemic coming to an end, we're still ahead of where we were before — even if Putin's invasion of Ukraine, inflation, and sky-high product prices are still in play. In any case, all of these factors mean that it'll be interesting to follow future developments in the e-commerce industry.
If you want a sneak-peek or want to understand your own market position compared to the average, feel free to contact us for more insights.

CPO & Partner
Thomas is the CPO (Chief Product Officer) and Partner at Bonzer, which means his day-to-day focus lies in constantly analyzing Google's algorithm and developing SEO as a product. Thomas has worked with SEO for several years with a strong passion for sharing his knowledge on how businesses can best implement SEO into their operations. In addition to Bonzer, Thomas contributes his expertise to readers at publications like Search Engine Journal, DanDomain, and Detailfolk. He also teaches Digital Media Strategy at Copenhagen Business School and SEO at DMJX in Copenhagen. If you have any questions or requests regarding the SEO universe, feel free to contact him at [email protected].

Let us show you an SEO strategy that can take you to the next level
A brief meeting, where we review your position in the market and present the opportunities.
Let us show you an SEO strategy that can take you to the next level
A brief meeting, where we review your position in the market and present the opportunities.