Search Analytics & Reporting
How to build an SEO report that gets read: executive summary, dashboard, roadmap and the right data out of Search Console and GA4.
Reporting decides how SEO work is judged. Not because the report changes the results, but because it is the only version of the results most of your stakeholders will ever see. A month of good work described badly reads as a month of nothing.
A useful report does three things at once: it shows performance, it shows what was done, and it teaches the reader enough to interpret both. The structure below is the one we have settled on after several years and 3,000+ completed SEO analyses, and it works whether you are reporting internally or to a client.
The structure, from top to bottom
1. Start with an executive summary
There are usually two readers: the marketing lead who works with the detail, and a C-level reader who has four minutes. The summary is written for the second one, and it saves time for the first.
What belongs in it:
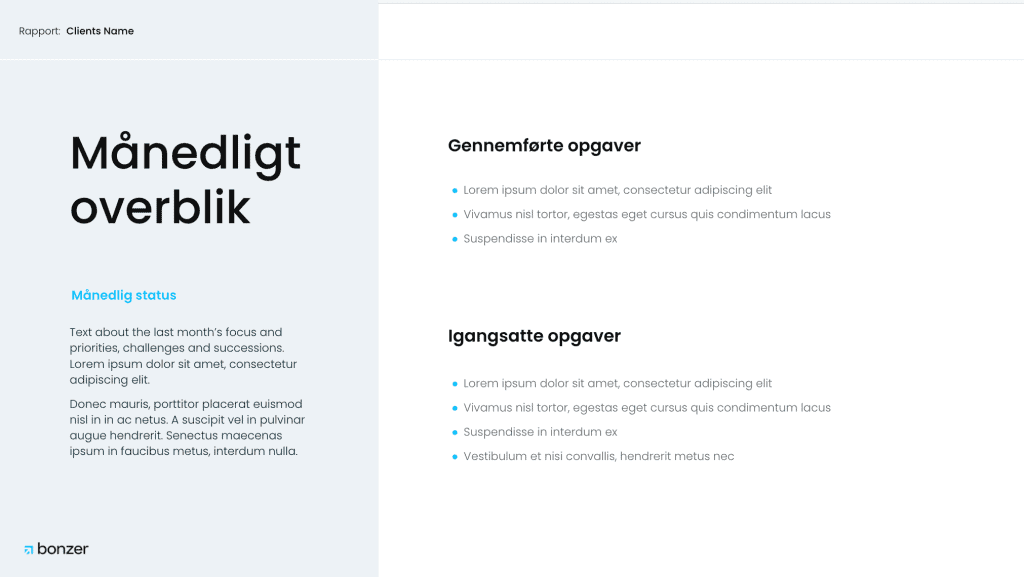
- A written comment from the lead specialist answering three questions: where are we in the roadmap, how is the project tracking against its goals, and what is the status of the most important initiatives
- A short view of work in progress and what comes next
Write it last and write it in plain language. If a sentence needs a definition to be understood, move it further down the report.
2. Give a performance overview in one dashboard
SEO produces a lot of connected metrics, and connected metrics spread across fifteen pages cannot be read as a picture. The point of a dashboard is that the reader sees the whole month in one view before anyone explains anything.
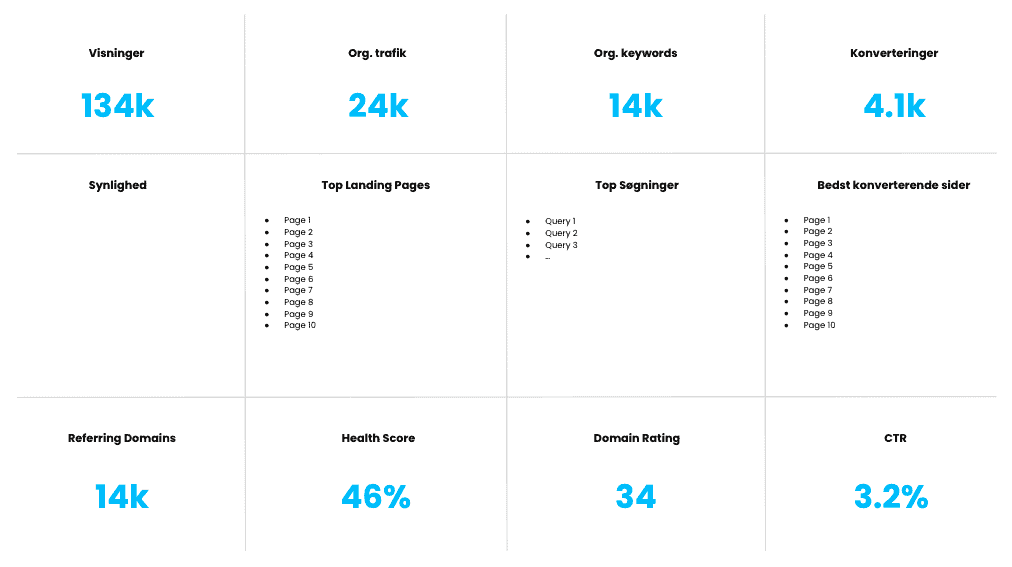
Two things make a dashboard work. Choose the metrics deliberately and tell the reader why each one is there. And agree the KPIs up front, so the report measures what the business decided to care about rather than what the tool exports easily.
3. Show the roadmap as a timeline
Nobody should ever be uncertain about how far along the project is. Visualize the whole roadmap and define the success criteria for each stage before you reach it.
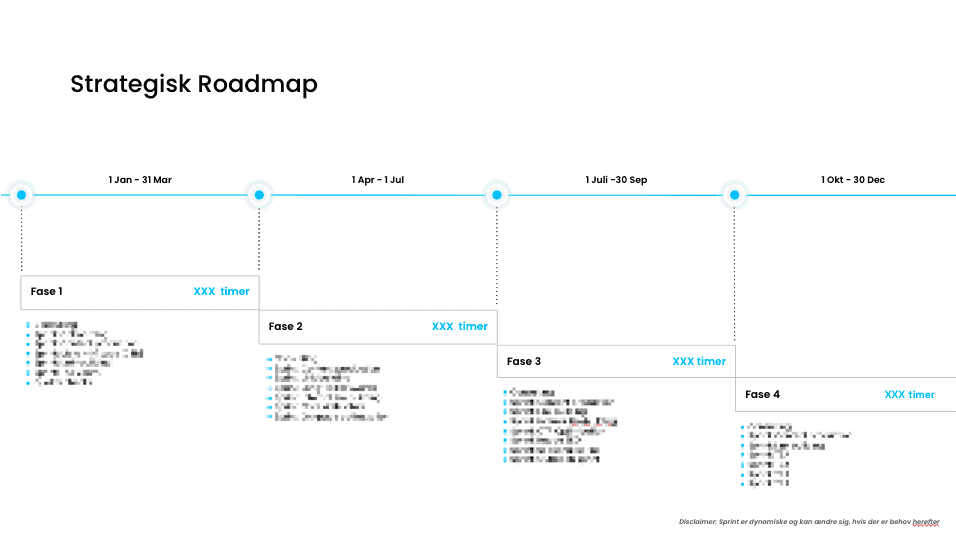
We build roadmaps in three-month phases with selected sprints inside each, which keeps the plan honest against a market that moves. A roadmap that has not changed in a year is not a plan, it is a wish.
4. Show the actual work
Include a section listing everything completed and in progress since the last report. Building organic performance is slow and largely invisible from the outside, and a report that shows only numbers invites the reader to imagine the work was easy or that it did not happen.
5. Spend real time on the charts
The reader will appreciate being able to decode a chart without help. Show the relevant data, label it, and cut everything that is decoration.
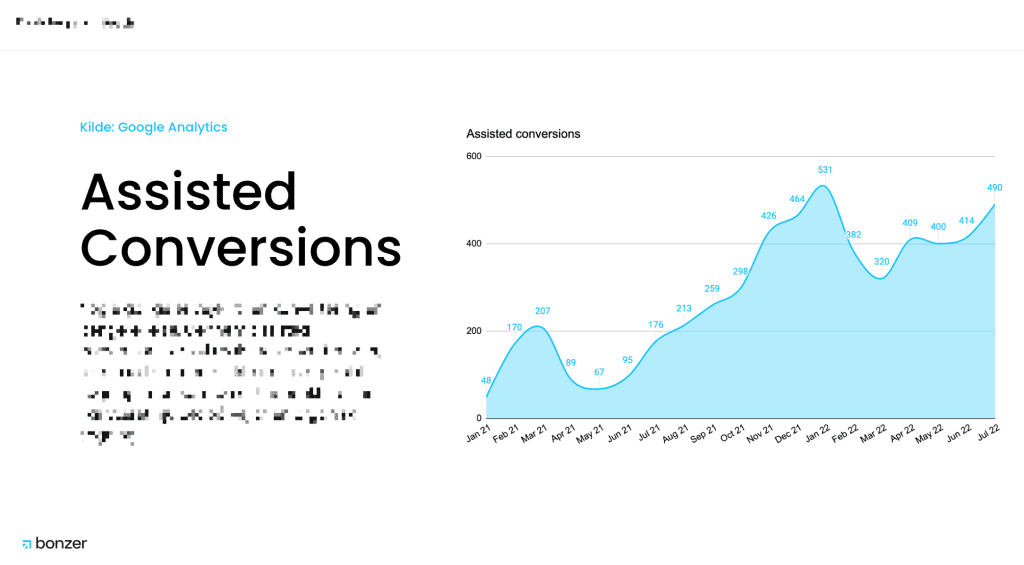
Datawrapper is free, produces interactive charts, and will do more for the readability of your report than another page of screenshots.
Where the data comes from
Four sources cover almost everything, and each answers a different question.
Google Search Console is the only place with Google's own view of your impressions, clicks, average position and queries. It is the source for how visible you are, and for the gap between visibility and clicks.
GA4 tells you what happened after the click: which landing pages carried organic sessions, which of them produced key events, and where people dropped out.
A rank tracker gives you position history on the terms you decided matter, plus the competitive context. Search Console tells you where you rank on average across everything; a tracker tells you what happened to the twenty terms you are being judged on. More on the toolbox under SEO tools.
AI search measurement is the fourth source, and it does not come out of a dashboard. Brand mentions and citations in ChatGPT, Copilot, Perplexity and AI Overviews have to be measured with a fixed prompt set, which is the method described in LLM monitoring. Leaving it out of the report does not make the surface less relevant to your buyers.
Getting the useful things out of GA4
GA4 is event-based, which means every interaction is recorded as an event rather than rolled into a page view. That is more flexible and less intuitive, and a few reports carry most of the value.
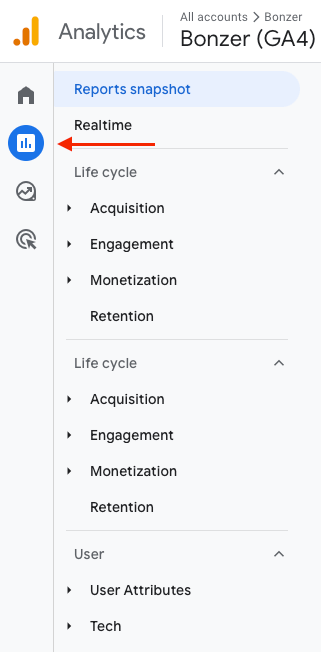
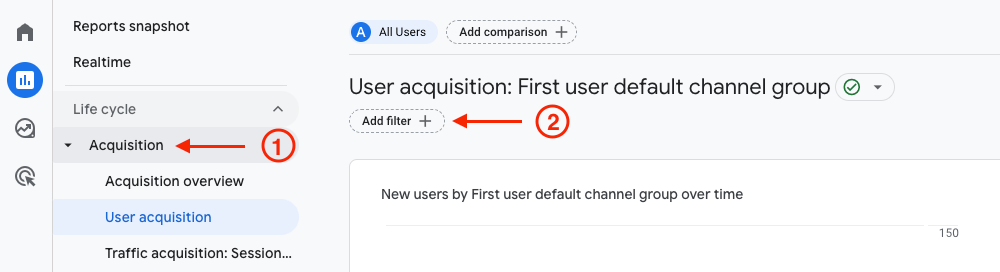
Traffic acquisition shows where sessions come from, segmented by channel and date range, and it is where you isolate organic search. It differs from user acquisition, which shows where new users came from. Report the first for performance and the second when the question is about reach.
Key events are what GA4 now calls the actions you have marked as important: a purchase, a form submission, a demo booking. Set them up before you need to report on them, because GA4 cannot backfill an event that was never configured.
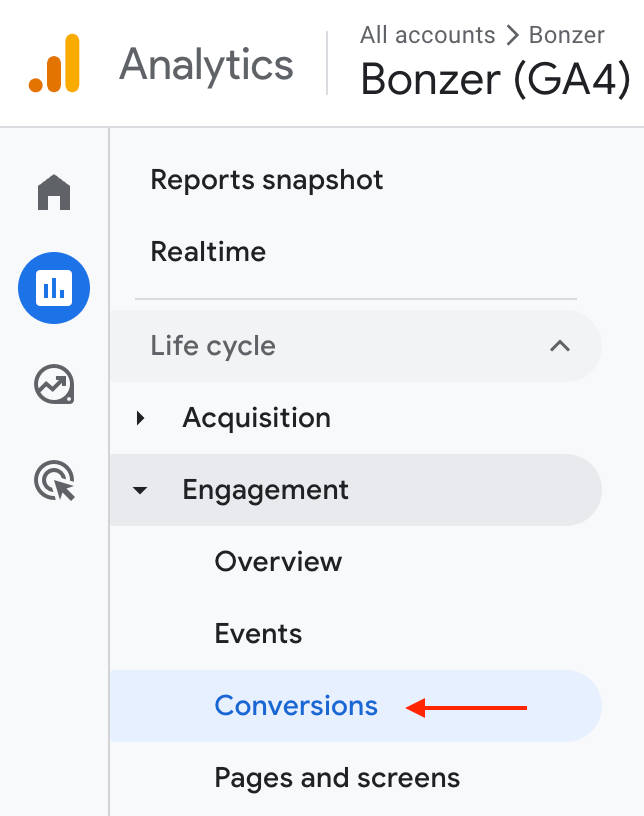
Engagement and landing pages is where organic performance gets useful at page level. Note that GA4 defines bounce rate as the inverse of engaged sessions, so it is not comparable to the old metric and should not be reported as if it were.
The Search Console link is the one setting most accounts skip. Connecting the two in the admin panel puts queries and landing pages in the same interface, which is where the difference between an impressions problem and a conversion problem becomes obvious.
What separates a report that gets read
Set the benchmarks before the period starts, not when you write the report. Review the data on a fixed rhythm rather than only when reporting is due, because a monthly report written from monthly attention is a summary of surprises. Keep competitors in the picture, so growth is read against the market rather than against last month. And be explicit about what you learned that changes the plan, because a report with no consequences is an update, not a report.
If you want the reporting handled as part of the delivery, that is what tracking and reporting covers, and every free SEO analysis starts from the same data foundation.